
Now that you’ve completed a recovery test, you’re seeing new data appear in the Morpheus app each day.
This lesson will help you understand what that data represents and, more importantly, how to use it to guide your training and recovery decisions.
Morpheus doesn’t just show numbers — it turns your physiology into clear, actionable insights so you can train at the right intensity on the right days.
What This Lesson Covers
In this lesson, you’ll learn:
What your Recovery Score actually represents
How HRV reflects your body’s overall stress and readiness
How your recovery influences your daily training zones
Why trends over time matter more than any single day
How to avoid common mistakes when interpreting recovery data
By the end of this lesson, you’ll know how to use your recovery data to support consistent progress while reducing the risk of overtraining and burnout.
A Quick Reminder
Recovery data is not a judgment — it’s information.
Some days your recovery score will make perfect sense. Other days it may surprise you. Both are normal.
The goal of Morpheus is not to force you to train less, but to help you train smarter, adjusting intensity when needed so you can stay consistent over the long term.
Establishing Your Baseline
Morpheus uses your daily data to build a personal HRV baseline, which is essential for accurate recovery scores.
Here’s what to expect when getting started:
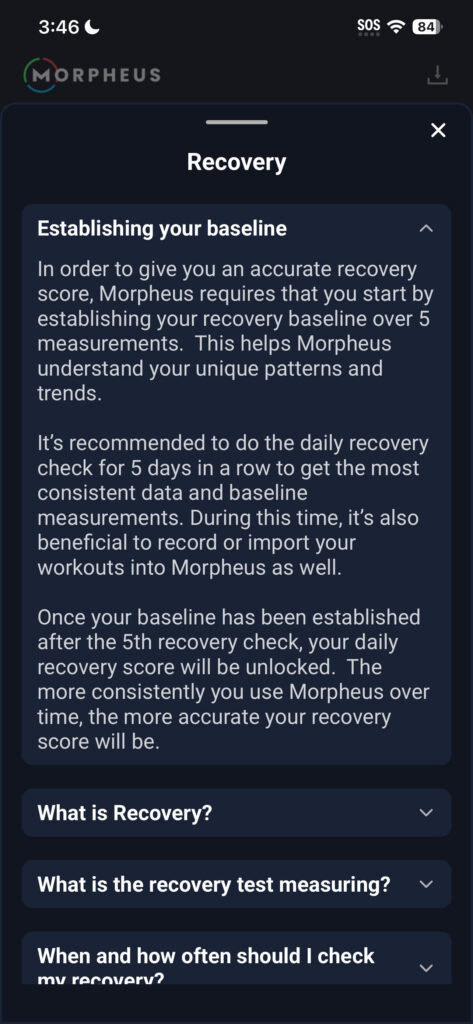
Your baseline typically takes 5-7 recovery checks to establish
Morpheus will not generate a daily recovery score until after your 5th recovery check.
- After each of the first 4 tests, you’ll see a progress circle toward your 5th test in the space where your recovery score will be after your 5th test.
- You will see your HRV and Resting HR and other metrics.
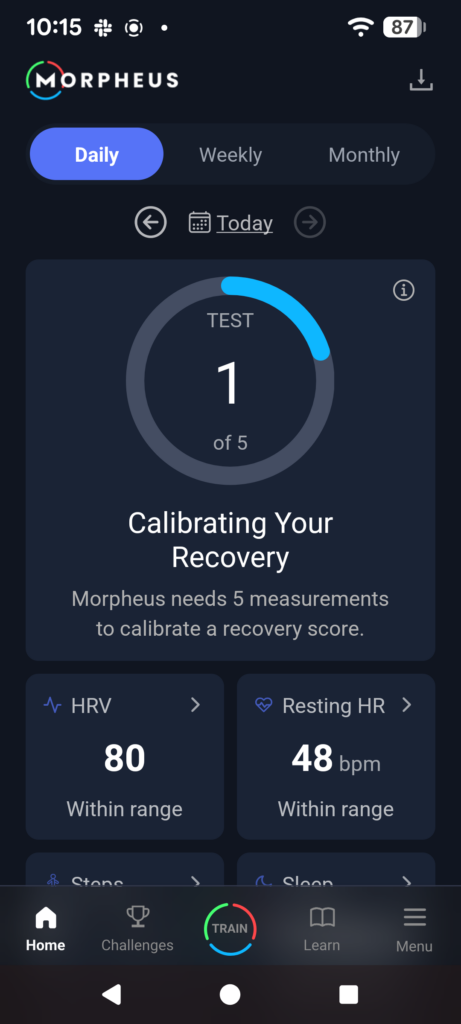
By tapping on the “i” symbol in the box, you see a page appear where you can read more about measuring recovery with Morpheus.
Recovery Score Colors
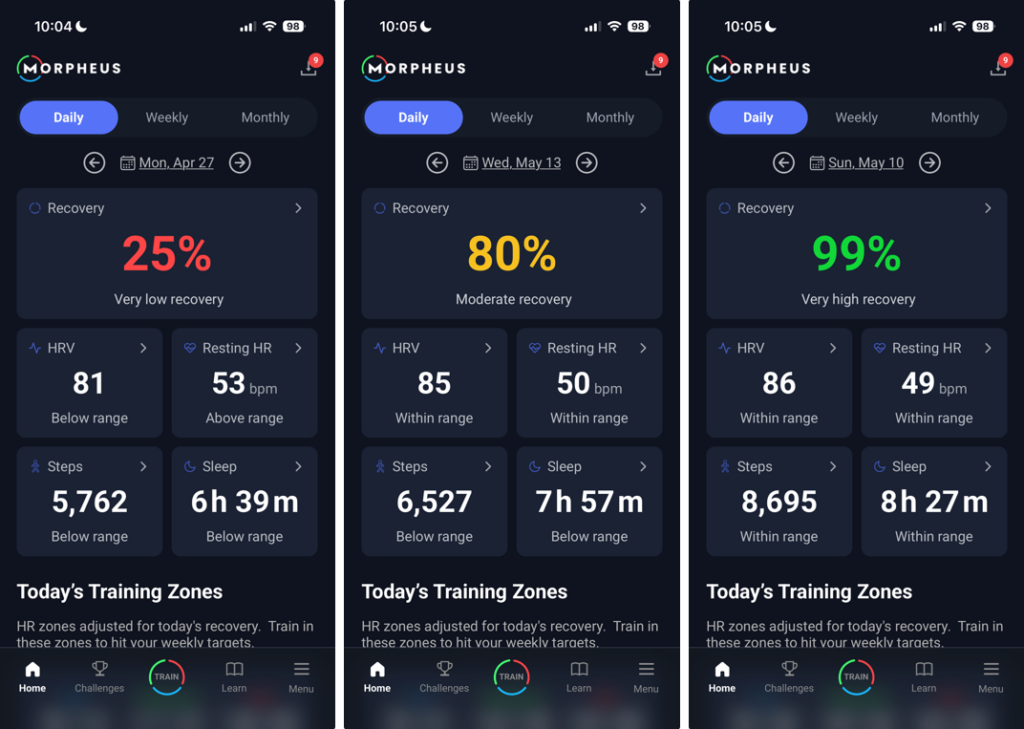
Your Recovery Score appears on the Home Screen as a percentage from 1–100%.
In addition to the percentage, your recovery score is color-coded to make it easier to interpret at a glance:
Green → Well recovered (81-100%)
Amber → Moderately recovered (41-80%)
Red → Low recovery (0-40%)
These colors provide a quick visual indicator of how ready your body is for training (or other stressors) that day.
What Affects Your Recovery Score?
HRV is the single most important factor in your recovery score.
Morpheus uses a rolling 10-day average HRV and compares “today” against this rolling avg
The further your daily HRV is from this average, the more your recovery score may decrease
This HRV range sets the possible recovery score for the day
Other factors then adjust the score up or down within that range, including:
Resting heart rate
Sleep quantity & quality
Previous day’s training load and recovery impact
Muscle soreness
Subjective feelings of fatigue and well-being
If HRV measurements are less frequent (for example, only 3 tests in the last 10 days), Morpheus will:
Create a wider possible recovery range
Place slightly more weight on the other inputs
Even in this case, HRV will always have the greatest influence on your recovery score.
If you stop using Morpheus for more than 7–10 days, your baseline will need to be re-established
As more data is collected, your recovery scores become more personalized and meaningful.
When HRV Is Outside Your Normal Range
Your recovery score isn’t based on whether HRV is simply “high” or “low.”
It’s based on whether your HRV is within your personal normal range.
That means:
HRV that is lower than normal can reduce recovery
HRV that is higher than normal can also reduce recovery
Both situations indicate that your nervous system may be under stress or responding to something outside your usual pattern.
Why Higher HRV Can Still Lower Recovery
While higher HRV is often associated with good recovery, unusually high HRV can sometimes reflect:
Nervous system overactivation
Accumulated fatigue
Travel, illness, or other physiological stressors
Morpheus is designed to detect deviations from your baseline, not reward extreme values in either direction.
Stability and consistency matter more than chasing the highest possible number.
How Morpheus Shows Your Normal HRV Range
Morpheus shows whether your HRV is within your normal range in two clear ways.
1. Recovery Factors View
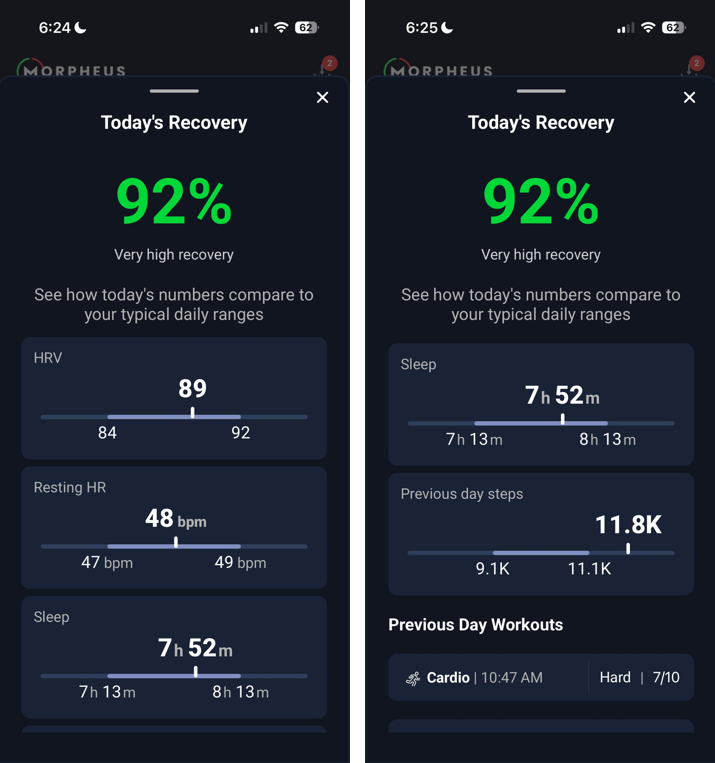
After each recovery test, you’ll see a screen that shows you the factors that contributed to your recovery score. On this screen, each metric is shown relative to your typical range.
If HRV is within your normal range, it supports recovery
If HRV is outside your normal range, it pulls recovery down
This view helps you quickly see which factors are helping or hurting your recovery score that day.
Note: this view will only appear when you have at least 5 recovery tests within the last 10 days.
2. HRV Charts (Weekly & Monthly)
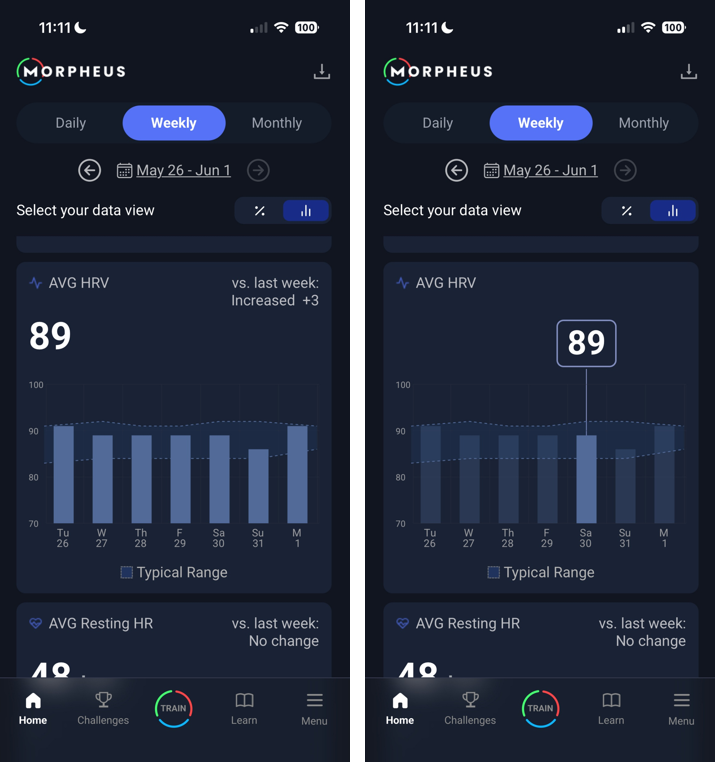
On the Weekly and Monthly HRV charts, Morpheus displays a shaded, dotted outline that represents your typical HRV range.
HRV bars inside the shaded area = within normal range = higher recovery score
HRV bars above or below the shaded area = outside normal range = lower recovery score
This makes it easy to spot patterns and trends over time, rather than focusing on a single day.
What to Focus On
Instead of asking:
“Is my HRV high or low?”
A better question is:
“Is my HRV normal for me?”
Recovery improves when HRV stays relatively stable and consistent relative to your baseline.
Short-term spikes or drops are normal — what matters most is how your HRV behaves over days and weeks.
When Recovery Doesn’t “Feel Right”
There will be days when your recovery score doesn’t match how you feel.
You might:
Sleep well
Feel good
Train lightly
Experience low perceived stress
…yet still see a lower recovery score.
HRV reflects many subconscious physiological processes that you can’t directly feel or control. There is always a physiological reason—even if it isn’t immediately obvious.
Recovery tools exist because we cannot reliably feel recovery on our own.
Rather than focusing on a single day, the most effective approach is to:
Look for patterns and trends
Use recovery data consistently over time
Make small, informed adjustments to training when needed
Focus on Patterns, Not Single Days
One recovery score doesn’t define your fitness or readiness.
What matters most is:
How your HRV and recovery trends over time
How training load and recovery interact
Whether you’re adjusting when needed
Using Morpheus consistently helps you see these patterns clearly.
Morpheus lets you look at everything from the context of a daily, weekly, and monthly picture.
If you get each day right, your weekly numbers will be there they should be. If you get each week right, then your monthly numbers will also fall into place.
If you do that over and over again, you’ll get in much better shape over time because you’ll win the long game of fitness.
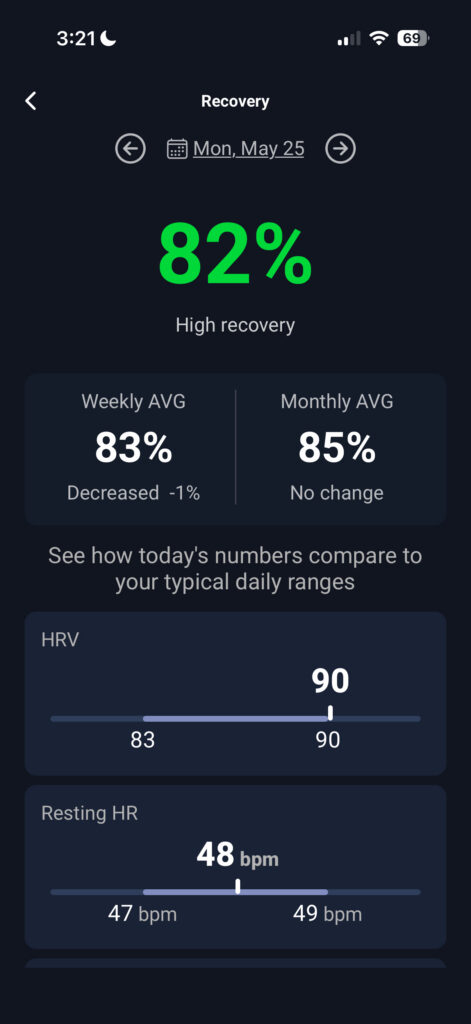
This single view shown below (which you can access by tapping on your recovery score on the Daily screen) gives you the best overall gauge of how well you’re balancing training and lifestyle stress with recovery.
Low 80’s for weekly and monthly averages is generally the right place to be. On a daily basis, it’s normal to dip below 80% once or twice a week.
Final Thought
Your recovery score isn’t just a number—it’s a signal.
Understanding why it changed is what allows you to use Morpheus intelligently, make better daily decisions, and stay consistent over the long term.